
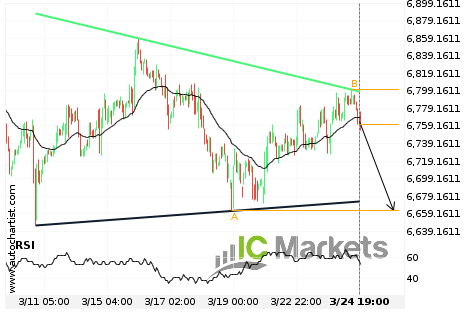
Will Australia 200 Index have enough momentum to break support?
Australia 200 Index is heading towards the support line of a Triangle and could reach this point within the next 3 days. It has tested this line numerous times in the past, and this time could be no different from the past, ending in a rebound instead of a breakout. If the breakout doesn’t happen, […]
Hong Kong 50 Index – getting close to psychological price line
Hong Kong 50 Index is moving towards the support line of a Support. Because we have seen it retrace from this positions in the past, we could see either a break through this line, or a rebound back to current lines. It has touched this line numerous times in the last 46 days and may […]
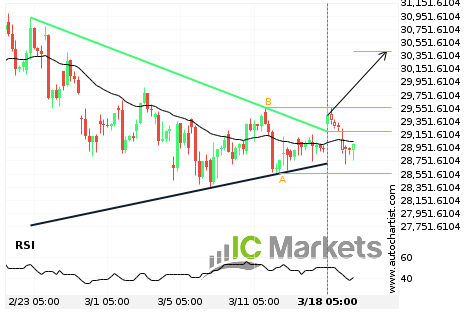
Hong Kong 50 Index – resistance line breached
Hong Kong 50 Index has broken through the resistance line of a Triangle technical chart pattern. Because we have seen it retrace from this position in the past, one should wait for confirmation of the breakout before trading. It has touched this line twice in the last 24 days and suggests a target line to […]
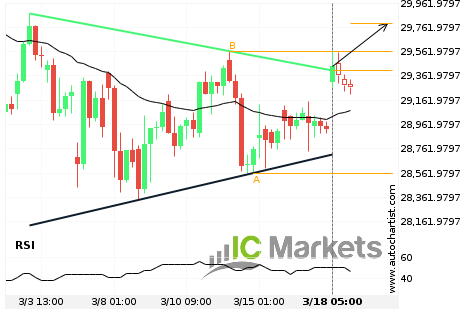
Hong Kong 50 Index – resistance line breached
Hong Kong 50 Index has broken through the resistance line of a Triangle technical chart pattern. Because we have seen it retrace from this position in the past, one should wait for confirmation of the breakout before trading. It has touched this line twice in the last 16 days and suggests a target line to […]
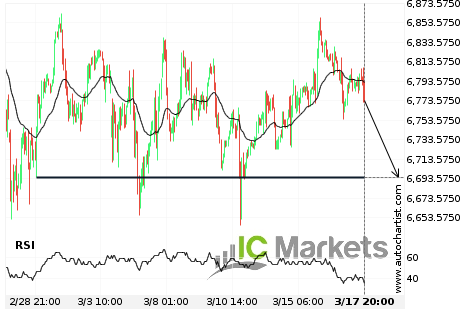
Should we expect a breakout or a rebound on Australia 200 Index?
The movement of Australia 200 Index towards 6695.3198 price line is yet another test of the line it reached numerous times in the past. We expect this line test to happen in the next 3 days, but it is uncertain whether it will result in a breakout through this line, or simply rebound back to […]
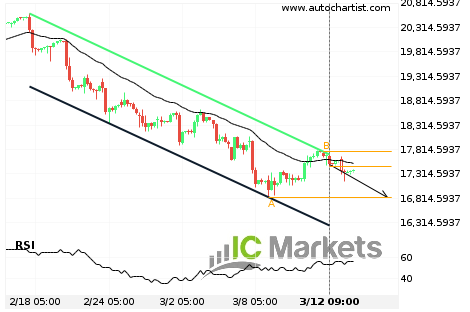
Should we expect a breakout or a rebound on FTSE China A50 Index?
The movement of FTSE China A50 Index towards the support line of a Channel Down is yet another test of the line it reached numerous times in the past. We expect this line test to happen in the next 2 days, but it is uncertain whether it will result in a breakout through this line, […]
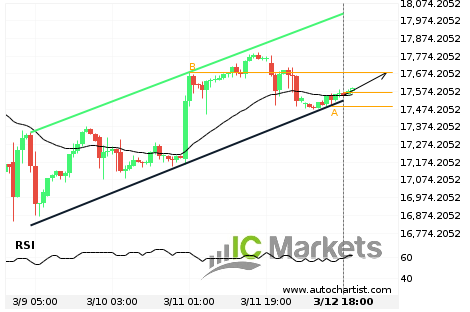
FTSE China A50 Index approaching resistance of a Channel Up
FTSE China A50 Index is approaching the resistance line of a Channel Up. It has touched this line numerous times in the last 4 days. If it tests this line again, it should do so in the next 22 hours.
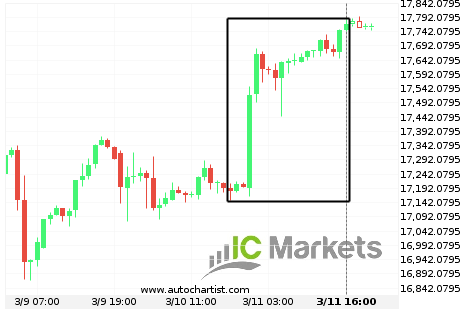
Where is FTSE China A50 Index moving to?
A movement of 3.41% over 23 hours on FTSE China A50 Index doesn’t go unnoticed. You may start considering where it’s heading next, a continuation of the current upward trend, or a reversal in the previous direction.

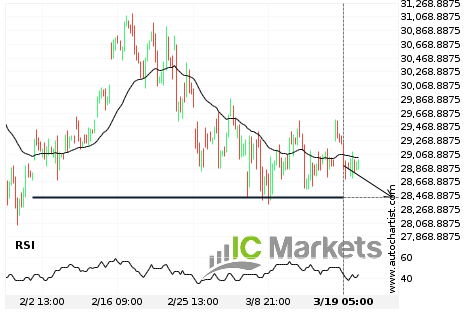
Hong Kong 50 Index is on its way down
Hong Kong 50 Index has experienced an exceptionally large movement lower by 5.18% from 31,063.05 to 28,646.6 in the last 20 days.